Executive Sales & Profitability Dashboard
Sep 18, 2025
BI Developer/Data Analyst

Tech: Excel · Power BI · Power Query · DAX
Repo: https://github.com/Durianlychee/sales-dashboard-tail-winds
Author: Abdul Rahman Addakhili Ibrahim
Project Overview
This project involved the development of a comprehensive Power BI dashboard to provide key insights into a company's sales and profitability performance. Starting with three raw CSV datasets, I executed a full-cycle business intelligence process. This included data cleaning and transformation (ETL), the creation of a relational data model, and the design of an intuitive and interactive dashboard to empower data-driven decision-making. The dashboard offers a multi-faceted view of performance, analyzing key metrics across different countries, products, and time periods.
Business Objective
The primary challenge was the inability to perform cross-functional analysis due to data being siloed in separate files. This prevented stakeholders from answering critical business questions. The goal of this project was to consolidate this data into a single, reliable source of truth, enabling leadership to:
Track and compare sales and profitability across different global markets.
Identify the most and least profitable products.
Analyze trends in sales performance and profit margins over time.
Understand customer loyalty and value by region.
My Technical Process
Data Extraction & Transformation: The initial phase involved importing the three CSV files into Power BI. I then utilized Power Query to profile the data, identify inconsistencies, and apply a series of transformations. This ensured data quality and prepared the datasets for modeling. The complete Power BI project file (.pbix), including all code and configurations, is available for detailed review in the project's GitHub repository.
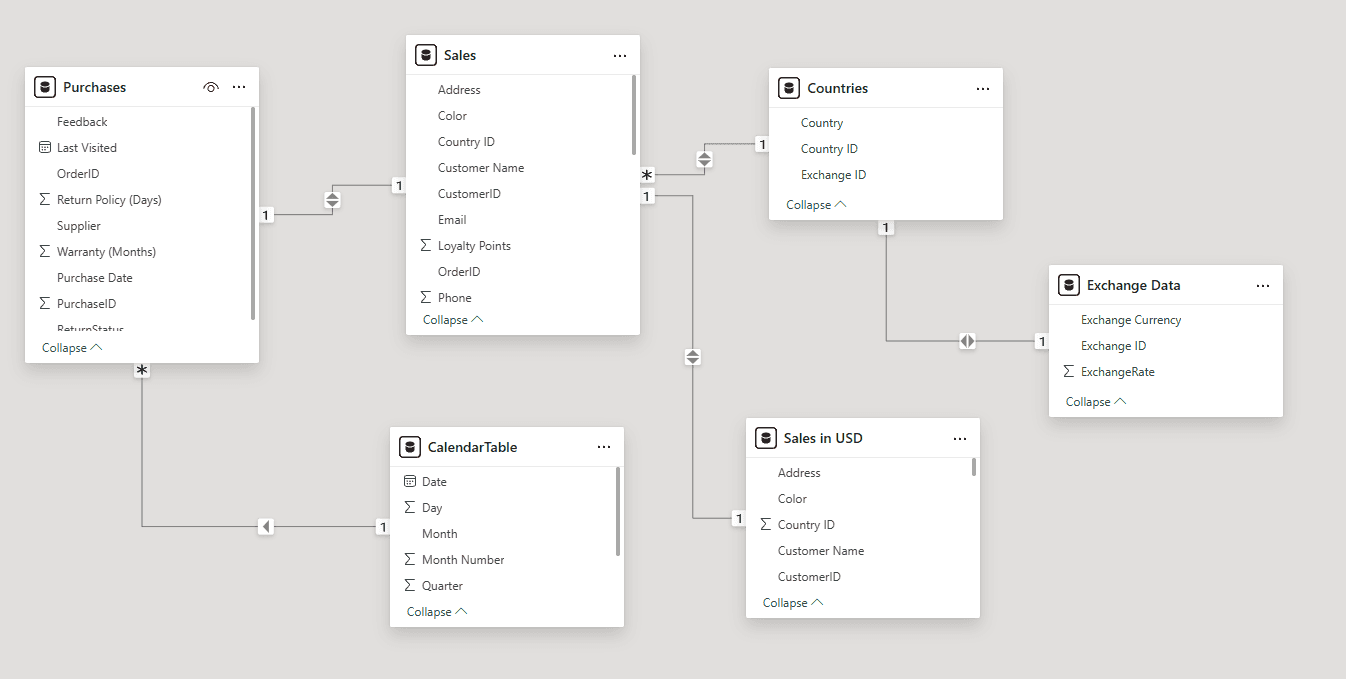
Data Modelling & Relationship Creation: After cleaning the data, I focused on building a relational model. By establishing connections between the tables based on common keys, I created a cohesive and optimized data structure essential for the dashboard's functionality. I implemented a star schema, which is a best-practice approach in BI. This model features a central sales fact table connected to dimension tables for Products, Countries, and a Calendar.
I authored several custom calculations using Data Analysis Expressions (DAX) to create the core metrics for the dashboard including Year To Date Profit Margin, Median Sales, Quarterly, and Yearly Profit Margin.
Insight Generation & Dashboard Design: The final step was to translate the structured data into meaningful insights. I carefully selected a range of visualizations to best represent the different facets of the data. The dashboard was designed to be interactive, allowing users to filter and drill down into the data to explore trends and patterns.
Key Insights & Analysis
The completed dashboard provides a wealth of actionable insights, including:
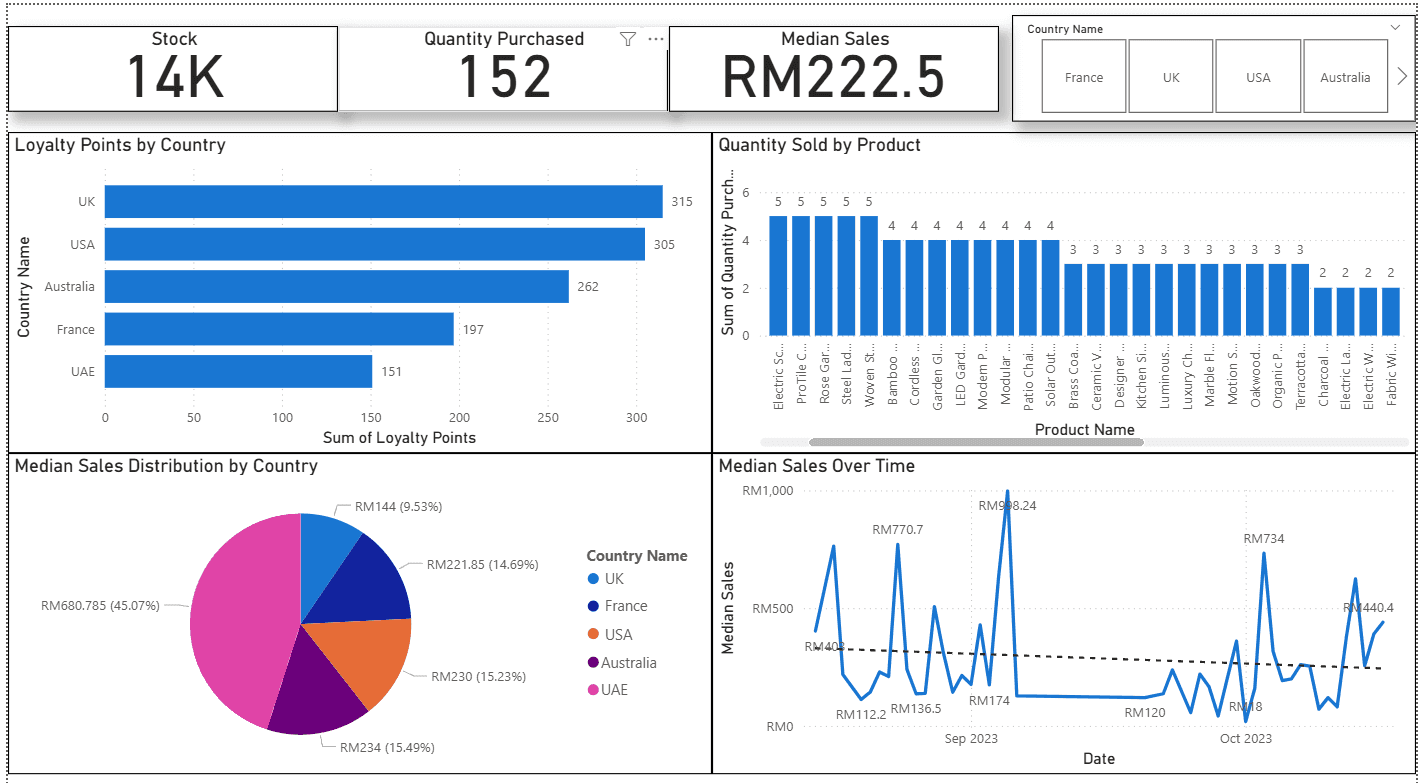
Sales Performance: The "Quantity Sold by Product" chart identifies the top-selling items, while the "Median Sales Over Time" graph reveals trends and seasonality in sales performance.
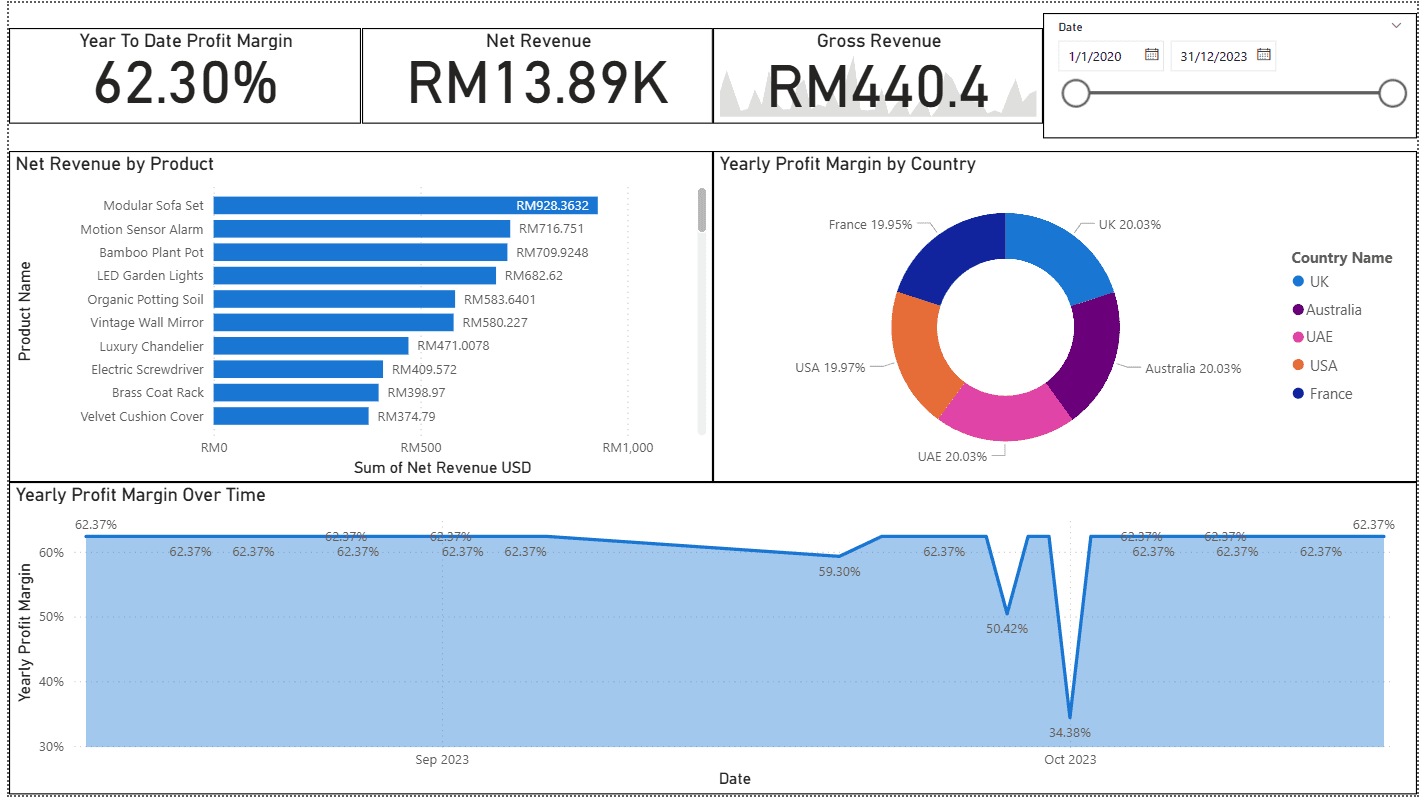
Profitability Analysis: The "Yearly Profit Margin by Country" donut chart provides a clear comparison of profitability across different regions. The "Yearly Profit Margin Over Time" area chart tracks the overall health of the business's profit margins.
Customer Loyalty: The "Loyalty Points by Country" bar chart highlights which countries have the most engaged and loyal customer base.
Revenue Contribution: The "Net Revenue by Product" visual pinpoints the most lucrative products in the company's portfolio.
Dashboard Page 1: Sales & Customer Insights
Dashboard Page 2: Profitability & Revenue Analysis
Conclusion & Impact
While the UK and USA lead in customer loyalty points, the "Median Sales Distribution" chart clearly shows that UAE drives over 45% of the median sales value with RM680.78 per transaction. This identifies UAE as a market of high-spending customers. The strategic focus should be on increasing customer acquisition and purchase frequency in this region, as each transaction yields significantly higher value.
The "Yearly Profit Margin Over Time" chart reveals a sharp, anomalous drop in profit margin to 34.38% in October 2023, deviating significantly from the stable ~62% margin seen in other months. This is a critical alert that requires immediate investigation. The first step would be to analyze the product mix, cost of goods, and any promotional activities that occurred in October to pinpoint the root cause of this profitability issue.
© 2025 Addakhili Ibrahim. All Right Reserved