SpaceX First Launch Outcomes End-to-End
Sep 28, 2024
Solo Data Scientist & Developer

Tech: Python · Jupyter · Pandas · Matplotlib/Seaborn · scikit‑learn · Folium · Dash · SQLite/SQL
Repo: https://github.com/Durianlychee/rocket-launch-killy
Author: Abdul Rahman Addakhili Ibrahim
Executive Summary
I built an end‑to‑end analytics and ML workflow to understand SpaceX Falcon 9 launch outcomes. The project covers data collection (API + web scraping), data wrangling & SQL exploration, EDA & geospatial visualization with Folium, and supervised learning (Logistic Regression, SVM, Decision Tree, KNN). The best baseline score reported in the repo is 83.33% test accuracy. An interactive Dash app Folium and Plotly were used and a slide deck communicate key findings to non‑technical audiences.
Summary of Results:
EDA Results: Showed relationships between flight number, payload, and orbit type with launch success.
Folium Maps: Displayed interactive maps with launch site details and proximity to coastlines
Plotly Dash: Visualized launch outcomes using interactive charts
Predictive Analysis: All models achieved similar test accuracy (~83.33%), with Decision Tree selected as the best model due to the highest training accuracy
Introduction
Space X advertises Falcon 9 rocket launches on its website with a cost of 62 million dollars while other providers cost upward of 165 million dollars each, much of the savings is because Space X can reuse the first stage. Therefore, if we can determine if the first stage will land, we can determine the cost of a launch. This information can be used if an alternate company wants to bid against space X for a rocket launch. This project aims to analyze SpaceX launch data to predict the likelihood of successful rocket landings.
Methodology
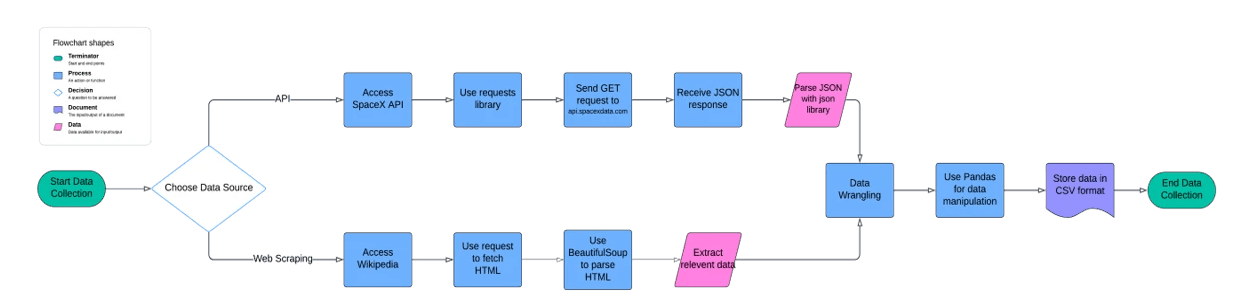
Data collection methodology:
The data collection for this project was executed through two primary methodologies: programmatic access via the SpaceX API and HTML web scrapping.
Perform data wrangling:
The missing values have been identified; landing outcome label is created
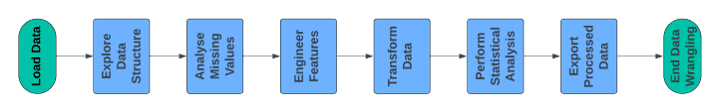
Perform exploratory data analysis (EDA) using visualization and SQL
We will conduct in-depth exploration of the dataset using various visualization techniques and SQL queries to uncover patterns, anomalies, and insights.
Perform interactive visual analytics using Folium and Plotly Dash
Advanced interactive visualizations will be created using Folium for geospatial data and Plotly Dash for dynamic, web-based analytics dashboards.
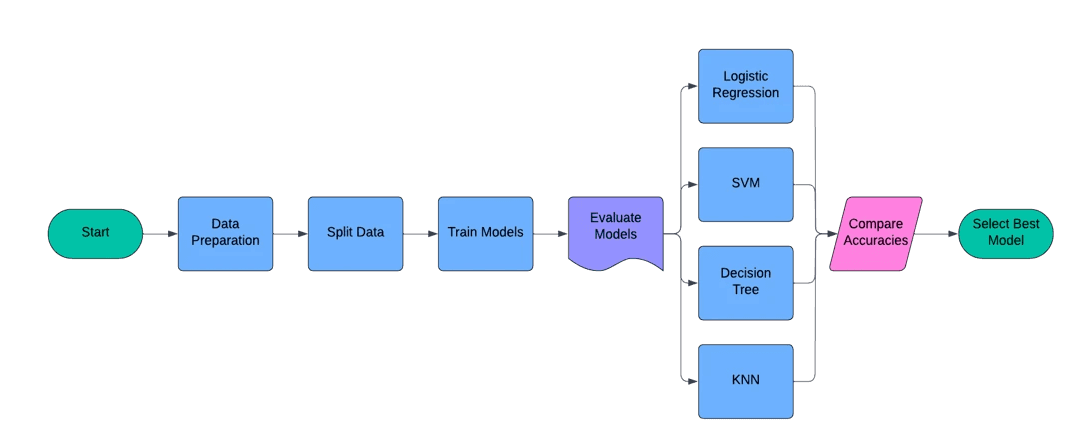
Perform predictive analysis using classification models
Model is build using training and testing data set, hyper parameters are tuned using gridsearchCV method and model is evaluated based on the accuracy
Results
This section highlights only the most important findings for readability. Full methodology, preprocessing, model configuration and additional metrics are documented in the repository PDF or download button below. Results are specific to the dataset and time range used and may change with updates. This is Educational/portfolio project and not affiliated with SpaceX.
Launch Sites Proximities Analysis
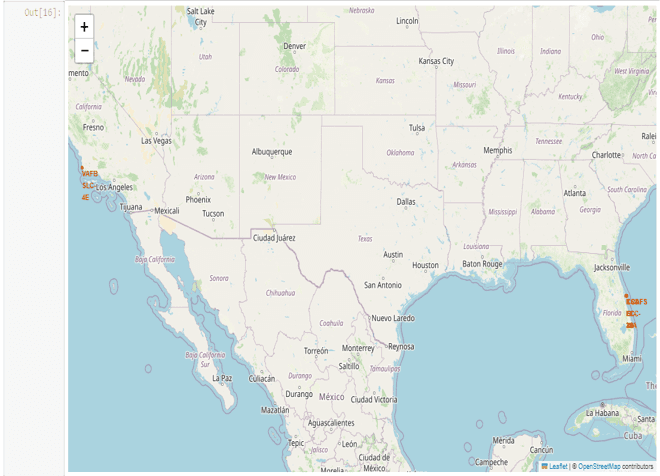
This map shows the location of all SpaceX launch sites marked with circles and labels. It provides a broad overview of the geographical distribution of launch sites
Key Findings:
All launch sites appear to be in close proximity to the coast, suggesting a preference for coastal locations
The launch sites are distributed across different parts of the United States, likely for strategic reasons
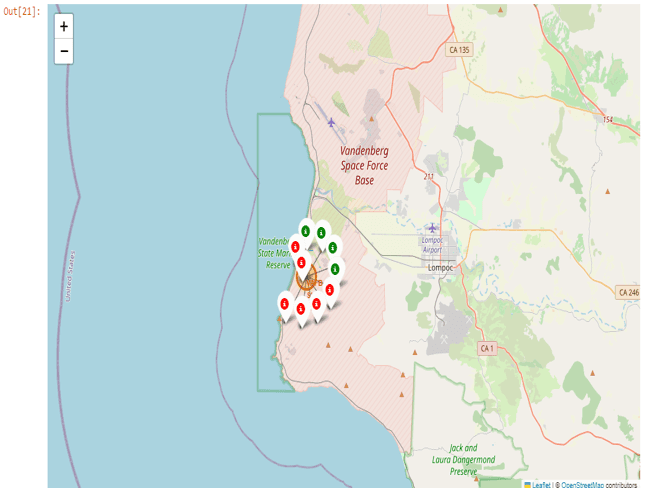
We uses a MarkerCluster to show all launch attempts, with green markers for successful launches and red markers for failed launches. This helps identify which launch sites have relatively higher success rates based on the predominance of green markers
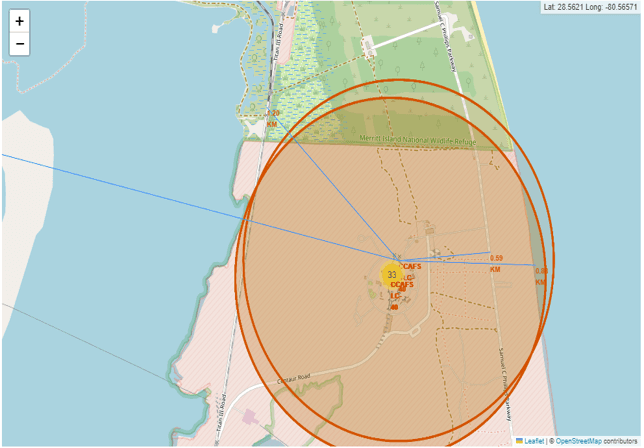
This map focuses on analyzing the proximity of a specific launch site (likely Kennedy Space Center) to nearby features such as coastline, railways, highways and cities. A distance marker is showing the calculated distance to the nearest coastline point
Interactive Dashboard with Plotly Dash Analysis
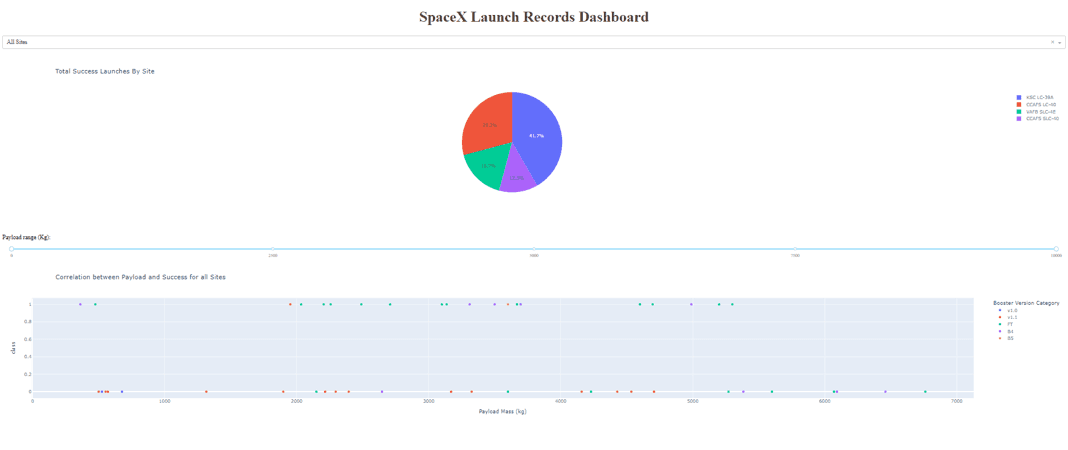
The Pie Chart shows the distribution of successful launches across different launch sites with KSC LC-39A has the highest percentage of successful launches at 41.7%, CCAFS SLC-40 follows closely with 25.7% of successful launches, VAFB SLC-4E accounts for 10.7% of successful launches and CCAFS LC-40 has the lowest percentage at 13.5%
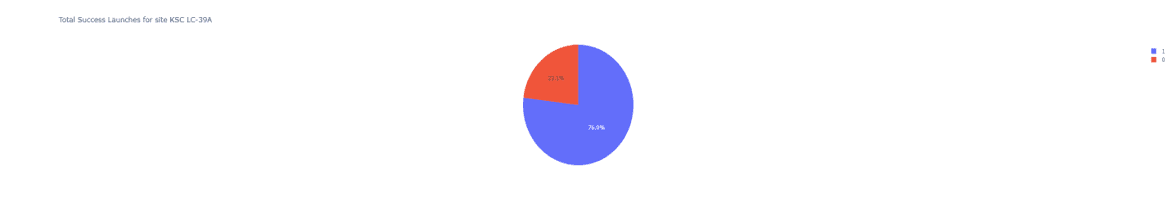
We're looking at the Pie Chart showing the success rate specifically for the KSC LC-39A launch site. There are two categories: successful launches (1) and failed launches (0). The success rate for KSC LC-39A is impressively high at 76.9% and Only 23.1% of launches from this site have failed. This chart highlights that KSC LC-39A is the most reliable launch site for SpaceX, with over three-quarters of its launches being successful.
From the Scatter plot, it shows the relationship between payload mass (x-axis) and launch outcome (y-axis, where 1 indicates success and 0 indicates failure). Different booster version are represented with different colors and the payload range can be adjusted using the slider at the top
Key findings:
No clear correlation between payload mass and launch success. Successful launches occur across various payload ranges
Most launches cluster in the 2,000 kg to 8,000 kg range and Booster versions FT and B5 appear most frequently and seem to have high success rates
Heavier payloads (>9,000 kg) show a slightly lower success rate, but there are fewer data points in this range.
Mid-range payloads (2,000-8,000 kg) have the highest concentration of successful launches, possibly due to more frequent missions and optimized systems for these masses
In conclusion, while payload mass doesn't strongly predict launch success, certain booster versions (particularly FT and B5) appear more reliable. The mid-range payloads have the highest number of successful launches, likely due to more missions in this range and well-tuned systems for these masses.
Predictive Analysis (Classification)
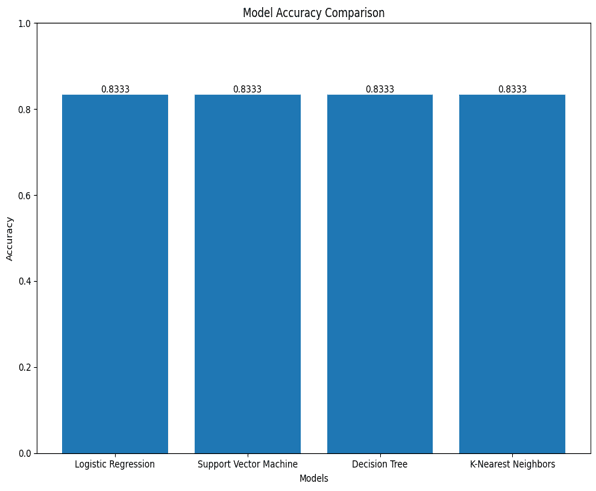
The bar chart shows the accuracy for all models (Logistic Regression, Support Vector Machine, Decision Tree, and K-Nearest Neighbors) have the same classification accuracy of 0.8333 (83.33%). This is an interesting result, as it suggests that all models performed equally well on the test set.
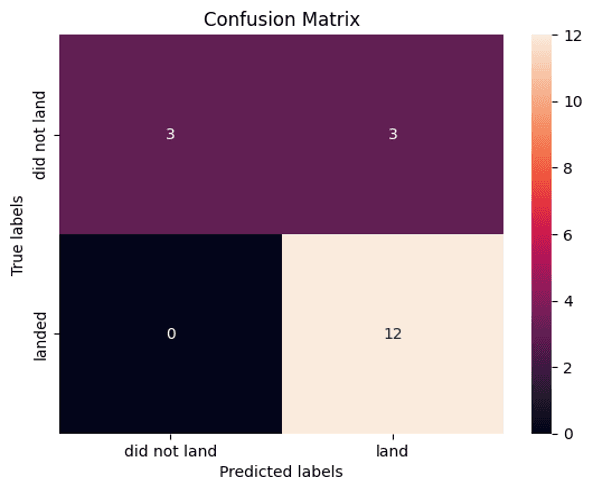
The confusion matrix for Decision Tree model shows True Negatives (TN): 12, False Positives (FP): 3, False Negatives (FN): 0 and True Positives (TP): 3. The model correctly predicted 12 cases where the first stage did not land. It correctly predicted 3 cases where the first stage did land. There were 3 false positives, where the model predicted a landing, but it actually didn't land and lastly there were no false negatives, meaning the model didn't miss any successful landings.
Conclusions
All four classification models (Logistic Regression, Support Vector Machine, Decision Tree, and K-Nearest Neighbors) achieved the same accuracy of 83.33% on the test set. This suggests that the problem may be equally well-suited to various classification approaches
The Decision Tree model showed good performance in distinguishing between classes. It correctly identified all successful landings and most of the unsuccessful ones (and potentially the others) while having the highest validation across others model.
False Positives: The main issue appears to be false positives (3 cases), where the model predicted a successful landing when it actually failed. This could be costly in real-world applications, as it might lead to overestimating the success rate of landings.
Limited Test Set: Given the small test set size (18 samples), these results should be interpreted with caution. A larger test set would provide more reliable estimates of the models' performance.
In the early years of SpaceX's landing attempts, they had more failures on drone ships than successes on ground pads. This is expected, as landing at sea is generally more challenging, and these represent some of the first attempts at booster recovery.
One important thing to mentioned is that the success rate for SpaceX Launch rise significantly, approaching near 100% by year 2020. This demonstrates SpaceX's improving technology and experience over time.
Appendix
The Python code snippets, SQL queries, charts, Notebook outputs, or data sets that used in this project provided in the GitHub repository link serves as the appendix. This code can be easily modified or expanded to include additional analyses or visualizations as needed
Credits & Acknowledgements
IBM Coursera teams for guidance and rubric
SpaceX API and public datasets used for educational purposes.
The full report, including detailed findings, is available below.
© 2025 Addakhili Ibrahim. All Right Reserved